вторник, 10 ноября 2015 г.

Adobe Mobile Service Implementation

Working as a digital intelligence analyst means that I should work with various data sources such as web analytical system or mobile applications trackers. In our company, we used Adobe SiteCatalyst and it allows us implement SDK to mobile apps and track lifecycle metrics such as launches, sessions and etc. Moreover, we can add custom variables and custom metrics.

Let's look closely on step by step manual how to start tracking mobile application with Adobe Mobile App Analytics.

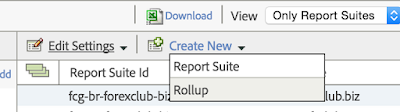
1. We should create new reporting suite. In the marketing cloud go to Admin->Reporting Suites. Select Create New > Report Suite:
I reckon to create separate reporting suite for every app and os.
2. Now we can go to https://mobilemarketing.adobe.com and add new app. In order to add new app we should choose reporting suite, create name and choose type. If we already have id of app in the store, we can add app by finding it in the store:
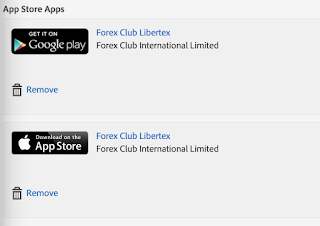
3. Next step is very important, because we should prepare technical documentation for mobile developers. Fortunately, adobe documentation is very detail and we can find all information there. Let's look, how should we prepare all staff in order to start tracking app.  For example in my case, we already have application in google and apple stores but we want to create new release with adobe sdk:
There is full documentation for ios and android. After adding or creating apps in adobe, we can download config and library for our OS:
Config file and OS library we should send to our developers. 
4. In addition, we should think about acquisition, because it is very important to track acquisition channels and measure their performance. In order to start create acquisition links, we should add in our config information about acquisition. Just enable SDK Acquisition Options and don't forget make Referrer Timeout at least 5 second, or it won't be work like in our case:)
We can learn more about acquisition for IOS and Android.
5. Finally, we can add custom metrics and variables. Let's go to "Manage Variables & Metrics" and add addition variables and custom metrics. There are 3 tab:
  • Standard Variables & Metrics
  • Custom Variables
  • Custom Metrics
We can learn more about standard metrics and variables for IOS and Android. In order to understand,  how to add custom fields, we should consider our app as a collection of screen and we can define various events on particular screen with some attributes, for example  event "Successful registration of an account" with some variables like date and time of registration, account number, type of account and etc. In other words, we should take screen from app and right list of events and variables for every screen and give it to developers, in order they put it in code and then map it in  "Manage Variables & Metrics" menu:
In this example, I asked developer to add in code s.evar7 and s.evar31 and then mapped them.

After successful release, we can start to track our app and use default charts of adobe mobile analytics. Let's look on some of them:

1. Overview report, which show as Unique Users, First Launches (Installs), Launches and Custom Events. We can change it in any way. Be careful with crashes and crash rate, it can be wrong, better to discuss with mobile developers. 

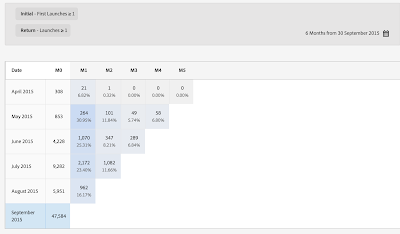
2.  Retention profile is a part of cohort analyses and help us to analyze each particular cohort and their life time.

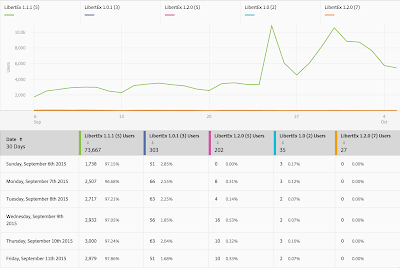
3. Version report - this one very useful in order to track bags after new release

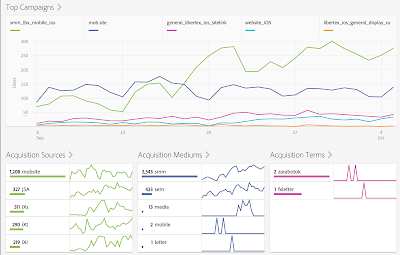
4. Acquisition overview - here we can analyze our marketing campaigns. In order to track new channel, we should create new link. which we can add to the add, for example in Google Adwords. Unfortunately,  we can't do it for facebook and twitter, in order to fix this problem we should add facebook SDK or twitter SDK to the app or use adjust or appsflayer, because they are integrated with them.


Mobile Pirate Metric Framework

What is pirate metrics and why it calls pirate?

Pirate Metrics analyzes your business by tracking 5 key metrics, then helps you improve your product and increase your revenue. It’s the best analytics tool for your subscription business. AARRR!*
*pirates always scream AARRR!
Acquisition - users downloads mobile application, we have their attention
Activation - user performs some key activity that indicates a good first visit, i.e. user enjoys first visit, happy experience
Retention - user continues to do that key activity indicating they like your mobile app
Revenue - user pays you
Reengagement - users has left the product without activation or not converted to real without deposit

Currently we have to trackers:
  • Adjust, because it helps us to run campaigns in facebook and twitter
  • Adobe Mobile Analytics because it is part of Adobe SiteCatalyst
There is top architecture of solution:

I collect data from adjust and adobe in redshift. Using Pentaho Data Integration, I run daily job which extract data from adjust table, which store in OLAP and in the same time run another job which take 2 files from adobe ftp, one for IOS and another for Android. All data goes to Redshift in staging are in separate table. In addition, I load data from DWH with deposits, costs and revenue amount.
Main challenge is to combine both trackers, because they have varius nature of data, various timezones and etc. I solved it for daily qty, using SQL. It is simple math. As etalon tracker I chose Adjsut, because it is more precise. Then we just calculate sum of installs per day for every channels and operationa system for Adjust. From Organic channel in adjust we should minus quanty of adobe install without adobe organic. As a result we get install by channels.

ETL process

I created 2 jobs. One for loading stg.stg_adobe and another one for loading stg.stg_adjust.

Loading stg_adjust

Run Pentaho DI

Pentaho home path: /home/dasboard/Downloads/data-integration
in order to start pentaha use terminal and run spoon.sh

Transformation 1: stg_adjust


This transformation extract data from mob.adjust for last 7 days and send it to s3://s3/webanalys/adjust_data in gzip format.

Transformation 2: sql_adjust

This transformation run sql queries:
--copy data from file to stg.stg_temp_adjsut

copy stg.stg_temp_adjust from 's3://webanalys/adjust_data'
credentials
'aws_access_key_id=<key>;aws_secret_access_key=<key>'
delimiter '|'
timeformat 'YYYY-MM-DD HH24:MI:SS'
gzip;
--delete data from stg.stg_adjust in order to write new fresh data
DELETE FROM stg.stg_adjust where stamp>= (SELECT MIN(stamp) FROM stg.stg_temp_adjust);
INSERT INTO stg.stg_adjust (SELECT * FROM stg.stg_temp_adjust);
--optimaze stg_adjsut table
analyze stg.stg_adjust;
vacuum stg.stg_adjust;

--delete from temp table all data
DELETE from stg.stg_temp_adjust;
vacuum stg.stg_temp_adjust;

Job: jb_adjsuttoAWS


Kitchen job

Pentaha allow as to schedule jobs via kitchen. Using crontab I run my job. Moreover, kitchen can perform only shell script. As a result I put my job in shell script:

#!/bin/bash
/home/dasboard/Downloads/data-integration/kitchen.sh -file=/home/dasboard/Downloads/pentaho_di_files/jb_adjusttoAWS.kjb -level=Minimal

Loading stg_adobe

In the same time, we should load data from Adobe mobile to redshift in separate table.
By default adobe allow us to use "datawarehouse" option in order to send data to adobe FTP.

Using pebtaho data integration, I can go to FTP, grab file and put it in local folder, then unzip and start to transform it and then send to S3 in order to incrementaly load in staging table for adobe. There is a job:

Let's look on transformation, which transform csv file and send it to S3. The main problem of adobe datawarehouse it it date format, like "10 November, 2015". It is not so comfortable for database. That's why with pentaho I quickly fix it:

And finaly, I run copy command in redshift:
copy stg.stg_temp_adobe from 's3://webanalys/ios7days' 
credentials 'aws_access_key_id=<key>;aws_secret_access_key=<key>'
delimiter '|'
timeformat 'YYYY/MM/DD HH24:MI:SS'
gzip;

DELETE FROM stg.stg_adobe where app_os='ios' and visit_date>= (SELECT MIN(visit_date) FROM stg.stg_temp_adobe WHERE app_os='ios');

INSERT INTO stg.stg_adobe (SELECT * FROM stg.stg_temp_adobe WHERE app_os='ios');
analyze stg.stg_adobe;
vacuum stg.stg_adobe;

DELETE  from stg.stg_temp_adobe where app_os='ios';
vacuum stg.stg_temp_adobe;

This example for IOS, the same is for android.

When we collect all data in stageing, we can build datamart in order to combine data from both trackers and enrich it with sales data.

Let's look on pirate metric, which I visualized with Tableau.

Dashboard consist of 4 tabs:

  • Acquisition - users downloads libertex
  • Activation - users enjoy first visit
  • Retention - users come back, invests multiple times
  • Revenue - user deposits real money


There are visualizations of main KPIs:


Revenue:


вторник, 27 октября 2015 г.

Mobile Dashboard in near real time

I chose Klipfolio as a perfect visualization tool for operation reporting. 

There is overview of working architecture:

Using Amazon Redshift Instance I collect  data from adjust. Adjust sends data to ourt local database via callbacks. Than using pentaho data integration as ETL tool I take data and load it to the redshift. Job in pentaho runs every 10 minutes and incrementally update last 7 days. Considering mobile applications we should considering long period, because some phones can send data to mobile tracker with long delayed, that's why I prefer to take 7 days and update them with each load.

Data Flow

Using Pentaho data integration I create 2 transformations and put them in one job.

Run Pentaho DI

Pentaho home path: /home/dasboard/Downloads/data-integration
in order to start pentaha use terminal and run spoon.sh

Transformation 1: stg_adjust


This transformation extract data from mob.adjust for last 7 days and send it to s3://s3/webanalys/adjust_data in gzip format.

Transformation 2: sql_adjust


This transformation run sql queries:
--copy data from file to stg.stg_temp_adjsut

copy stg.stg_temp_adjust from 's3://webanalys/adjust_data'
credentials
'aws_access_key_id=AKIAIFNNQI73NUWZ7BZQ;aws_secret_access_key=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'
delimiter '|'
timeformat 'YYYY-MM-DD HH24:MI:SS'
gzip;
--delete data from stg.stg_adjust in order to write new fresh data
DELETE FROM stg.stg_adjust where stamp>= (SELECT MIN(stamp) FROM stg.stg_temp_adjust);
INSERT INTO stg.stg_adjust (SELECT * FROM stg.stg_temp_adjust);
--optimaze stg_adjsut table
analyze stg.stg_adjust;
vacuum stg.stg_adjust;

--delete from temp table all data
DELETE from stg.stg_temp_adjust;
vacuum stg.stg_temp_adjust;

Job: jb_adjsuttoAWS


Kitchen job

Pentaha allow as to schedule jobs via kitchen. Using crontab I run my job. Moreover, kitchen can perform only shell script. As a result I put my job in shell script:

#!/bin/bash
/home/dasboard/Downloads/data-integration/kitchen.sh -file=/home/dasboard/Downloads/pentaho_di_files/jb_adjusttoAWS.kjb -level=Minimal

When we successful load data to redshift, we can build new klip using database connection in klipfolio.
Just choose postgres database and fill credentials. Unfortunately, klipfolio has one disadvantage, you should create separate query for almost every klip. 
My job runs every 10 minutes. As a result we get fresh data and can quickly check health of mobile applications and their performance.

Klips: Installs, Average Session duration in sec, registrations, daily active unique users, weekly active unique users, monthly unique users and installs by channels:


Adjust Implementation

Going deeper with mobile tracking, I start to look at new mobile trackers. And chose one of the leader - adjust. In order to implement adjust to our mobile apps, we should add SDK to the mobile app.

First of all we should read docs:
  • Getting Started https://docs.adjust.com/en/getting-started/
  • Event Tracking https://docs.adjust.com/en/event-tracking/
  • Tracke Generation https://docs.adjust.com/en/tracker-generation/
  • Integration with facebook https://docs.adjust.com/en/facebook/
  • Google ad tracking https://docs.adjust.com/en/google/

For mobile developers we should send link on github:
  • Github repo https://github.com/adjust/sdks


Then add our application to adjust by typing App ID:


In addition we should describe screens of app and events. If we want to send additional dimensions or attributes we should use callbacks. Because due to personal data law, adjust don't store customer data.
  • Working with callbacks https://docs.adjust.com/en/callbacks/

In order to create callback receiver, we should tell to system administrated, what fields will come from adjust. We can learn about default placeholders - https://partners.adjust.com/placeholders/

For example:


Then we should create events in adjust interface:


It has default events and we add some custom, Every custom event has unique token which we will give to mobile developer. Attributes should be connected to event. For example, registration event has account number and account type attributes. There is callback URL on the screen. We should put there link of callback server and list of placeholders in format key={value}. Adjust will replace value.

When mobile developers successful add SDK to the app, they can emulate activity and we can open adjust dashboard in order to see new events. Adjust has two environments. We can test, using SANDBOX in order not to mix with real data.

Going to statistics tab we can look at on default and custom events:


It is interesting fact, but install in mobile tracker it is just first launch. There is no integration with stores.


In addition we can look on events across channels or look at trends:


In order to create acquisition channel, we should go to App tab and click at "New tracker", adjsut will create link. And we can easy add to this link placeholders and custom parameters in order to collect this data in database.


Also it allows us to use cohort menu. For example, we can quickly to build retention profile:


Finally, we can look at rank and rating of mobile app. Unfortunately, we can extract this information from adjust.